|
Reports Menu > Visual Data and Reporting Studio |
The Visual Data and Reporting Studio allows users to build custom reports that can be saved and re-run in the future, or that can be exported to Excel.
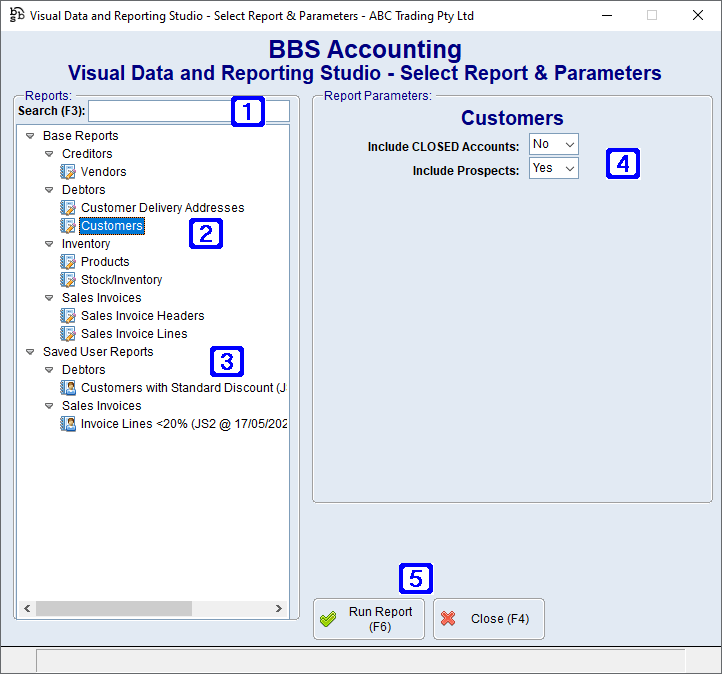
The Select Report & Parameters screen of the Visual Data and Reporting Studio allows users to select a report to run and to specify the parameters for the report.
Once a report is run, the main Visual Data and Reporting Studio screen is displayed. |
 Visual Data and Reporting Studio - Main Screen
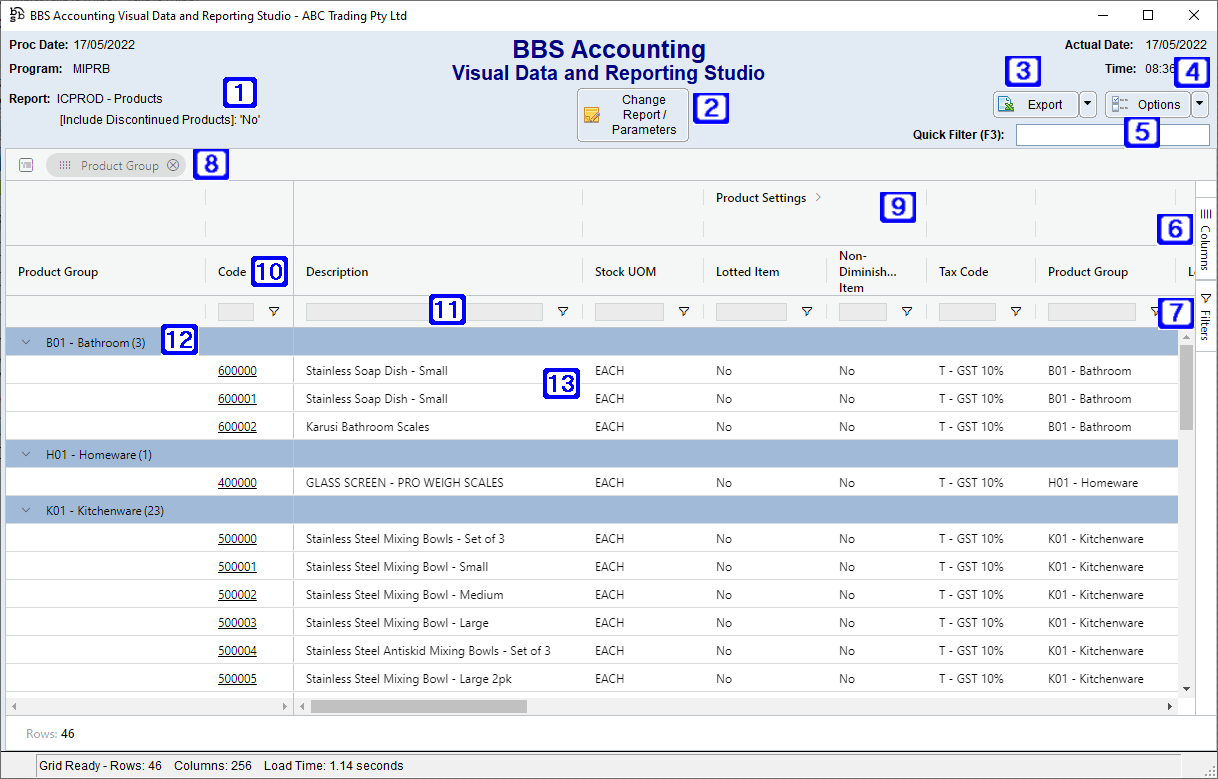
The main screen of the Visual Data and Reporting Studio allows users to view the created report and manipulate the visible columns, layout and filters.
 Visual Data and Reporting Studio Screen
|
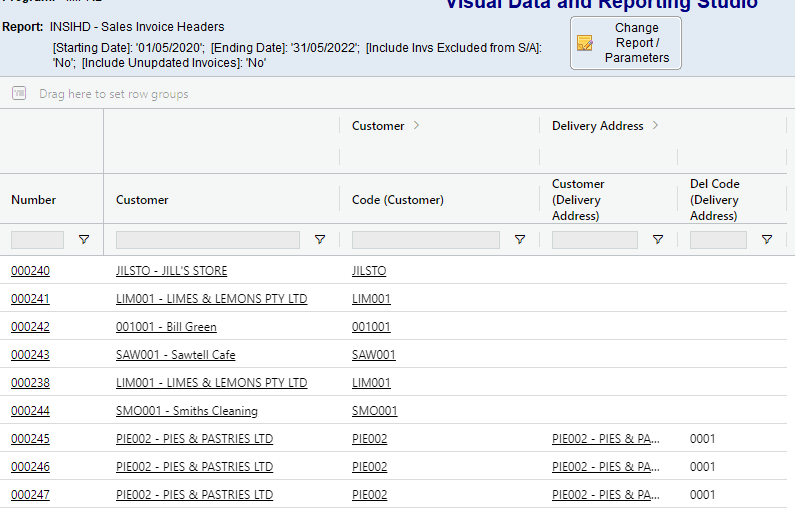
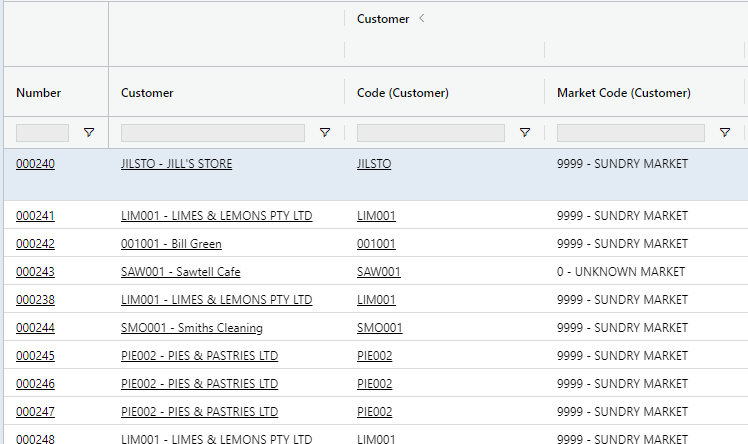
Some columns within reports are arranged into column groups of like columns. For example, when running the Products report, there are column groups for Product Settings, Purchasing Details (Primary Supplier), Pricing, Linked Products etc.
Column groups can be expanded or collapsed by clicking the > or < button on the column group heading.
Column groups can be dragged left and right to reorder all the columns within a column group, and entire column groups can be toggled on/off via the Columns Sidebar. |
Column headings allow users to sort, filter, resize and reorder columns on a report.
Column headings can be dragged left and right to reorder the columns on the report.
|
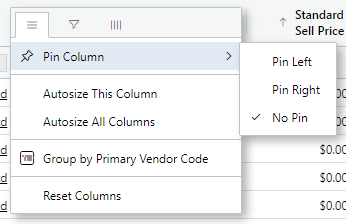
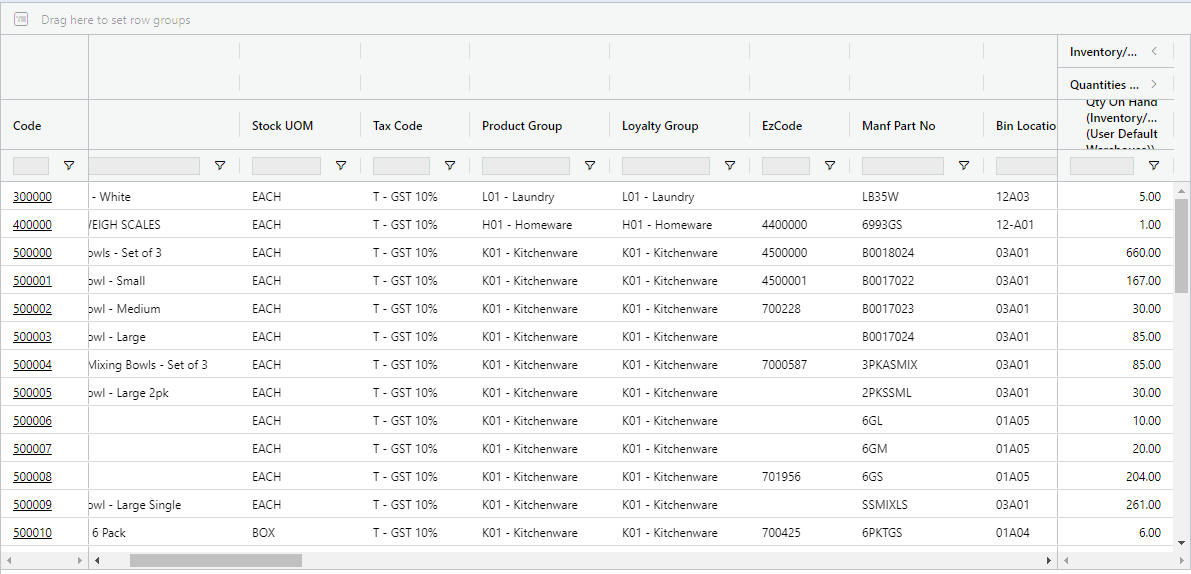
Columns can be pinned on the created report so that they are always visible when scrolling horizontally. Columns can be pinned either to the left or the right of the report.
In the example below, 'Code' is pinned to the left and Qty on Hand of the Inventory sub report is pinned to the right.
Columns can be pinned by dragging them to the far left or far right of the Data Panel, or via the Column Heading Menu. |
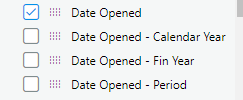
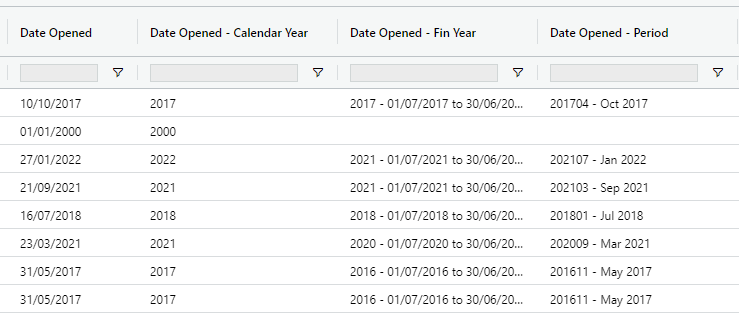
All date columns within reports automatically add three additional hidden columns that can be used for Row Grouping, Sorting Columns and Filtering Data where users want to group, sort or filter by year or period rather than the actual date.
•Calendar Year - The calendar year for the date column •Fin Year - The financial year for the date column •Period - The financial year and period for the date column
These columns can be accessed via the Columns Sidebar or the Column Heading Menu. |
Columns can be sorted by clicking on the Column Headings text which will toggle between ascending sort, descending sort and no sort. The sort indicator shows a user what sort is currently applied to the column (ie up arrow, down arrow, or no arrow).
When another column is selected for sorting, it will remove the sort from the first column and apply it to the new column.
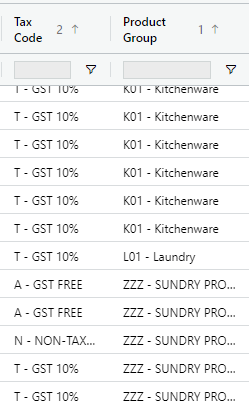
Multiple columns can be set to sort by holding down the SHIFT key while clicking on the Column Headings text. For example, to sort by Product Group then by Tax Code, click the Product Group heading, then hold down the SHIFT key and click the Tax Code heading. Numbers will appear next to the sort indicator showing what order the columns are being sorted in.
|
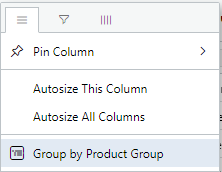
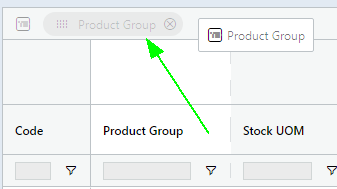
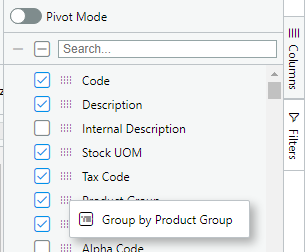
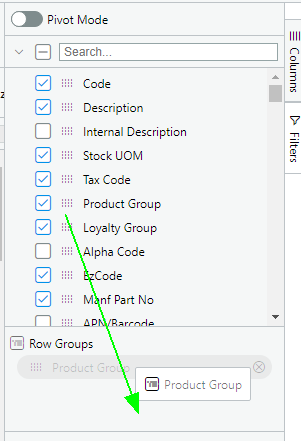
Reports can be grouped by columns on the report that display attributes of the data being reported. Columns displaying values such as quantities or dollar amounts are not able to be selected for row grouping. Row grouping allows a report to be broken up into sections with subtotals for each section (where applicable). Columns can be selected for row grouping by: 1.Selecting Group by [Column Name] from the Column Heading Menu, Options panel. 2.Dragging the column heading to the Row Group Panel 3.Right Clicking the column name in the Columns Sidebar and selecting Group by [Column Name]. 4.Dragging the column from the Columns Sidebar to the Row Group Panel. 5.Dragging the column from the Columns Sidebar to the Row Groups panel in the Columns Sidebar. Multiple columns can be selected for row grouping to allow for sections and sub-sections to be created within the report.
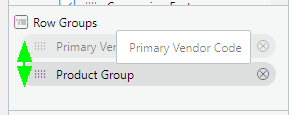
The selected row grouping columns can be reordered by dragging them left or right on the Row Group Panel.
Row grouping columns can be removed from row grouping by clicking the
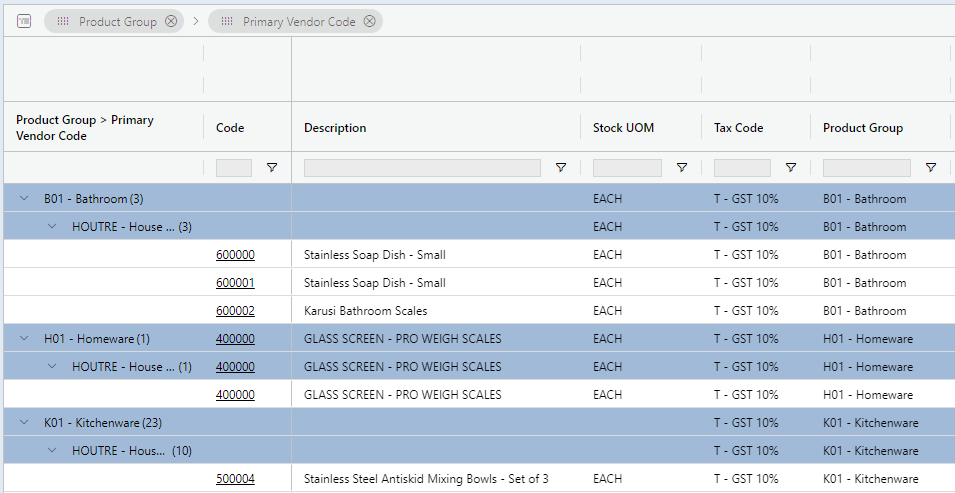
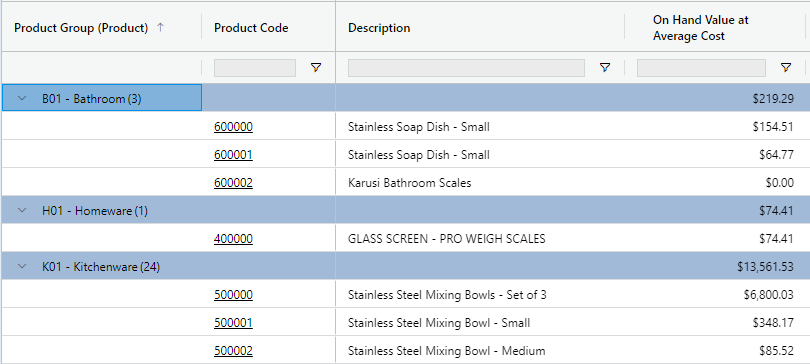
When row grouping is active, the columns that the report is being grouped by are visible in the Row Group Column which is pinned to the far left of the report. The up and down arrows on a row group heading can be used to expand or collapse a row group.
Where values exist on the report that can be totalled, sub-totals will be displayed for each row group heading.
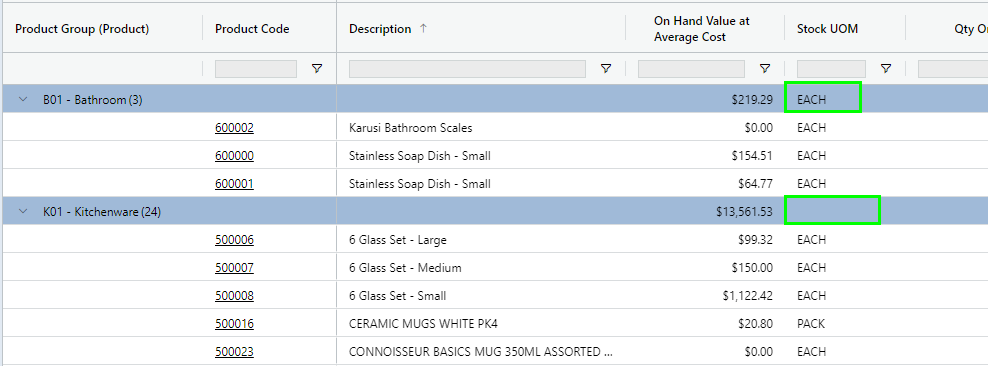
For columns that cannot be totalled (ie text and date columns), a value will only be displayed in the row group heading where all of the grouped data entries contain the same value. In the example below, EACH appears in the Stock UOM on the row group heading for the B01 - Bathroom product group because all products within that product group have the Stock UOM of EACH, however products in the K01 - Kitchenware product group have a mixture of Stock UOMs and therefore no value is displayed in the Stock UOM column on the row group heading. This feature can be enabled and disabled by toggling Show Unique Values in Row Group Headers in the Options Menu.
To expand or collapse all group rows, users can select Expand all Group Rows or Collapse all Group Rows from the Options Menu. To remove all columns from row grouping, users can select Remove all Group Rows from the Options Menu. |
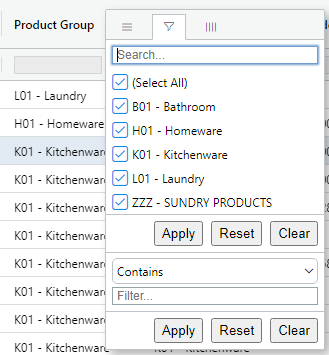
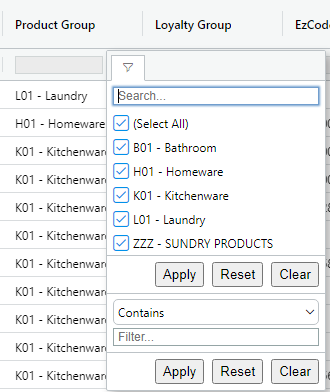
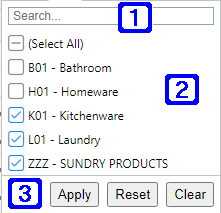
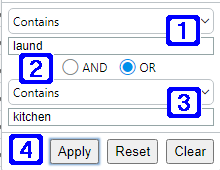
Data within a report can be filtered on a column-by-column basis. Filters are in addition to the report parameters that were initially selected when the report was created. Columns can be filtered by: 1.Using the Filter panel from the Column Heading Menu, 2.Clicking on the filter row within the column. 3.Selecting the column in the Filters Sidebar. Refer to Filters Sidebar for more information.
There are two different filter types available, the Set Filter and the Standard Filter, and both work independently of each other.
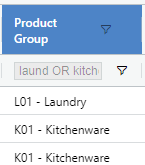
When a filter is applied to a column, the column heading changes colour and the conditions are visible in the Filter Row.
To clear all filters, users can select Clear all Filters from the Options Menu. |
The Data Panel displays the report data to users.
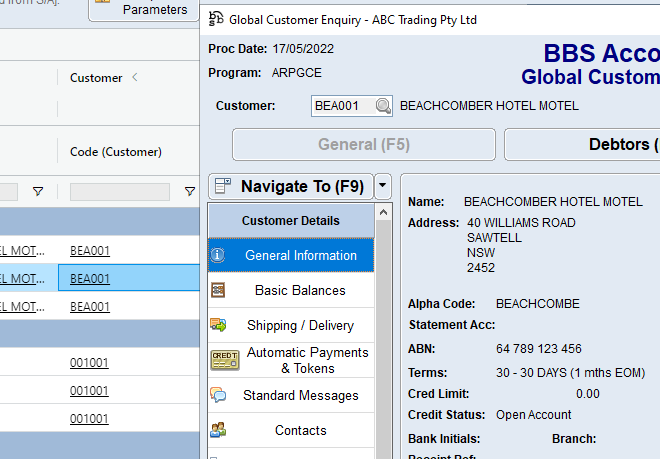
Where a value in the Data Panel is underlined, users can double click the value to navigate to the associated enquiry for that column. For example, double clicking a Customer will navigate users to the Global Customer Enquiry for the customer in question.
Users can click and drag to highlight multiple values within the Data Panel.
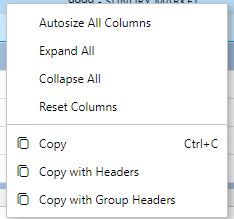
Users can right click within the Data Panel to access the Context Menu.
•Autosize All Columns - automatically resizes all visible columns based on their contents •Expand All - Where Row Grouping is enabled, this will expand all row groups. •Collapse All - Where Row Grouping is enabled, this will collapse all row groups. •Reset Columns - Resets all the layout of all columns to the default for the report.
•Copy - will copy the selected cells to the clipboard •Copy with Headers - will copy the selected cells to the clipboard with the column headers •Copy with Group Headers - will copy the selected cells to the clipboard with the column headers and group headers |
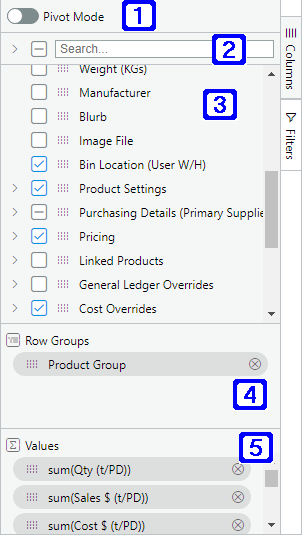
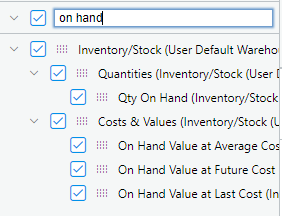
The Columns Sidebar allows users access to switch columns and column groups on/off as well as enabling Pivot Mode.
|
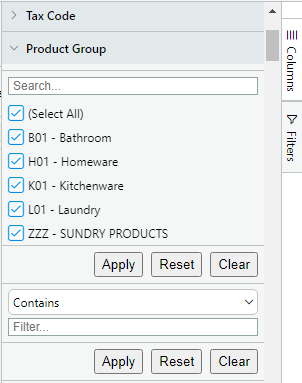
The Filters Sidebar provides an alternate method of applying filters to the report.
Please refer to Filtering Data for more information on how to apply column filters. |
|
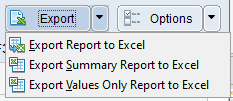
•Export Report to Excel - Allows users to export the full report to Excel. This option is not available when Pivot Mode is active. •Export Summary Report to Excel - When row grouping is enabled, users will be able to export the summarised data to Excel. This report will contain all columns but will only export row group header rows and the data visible in those (ie the columns row grouping is enabled for, unique section values if enabled, and the sub-totals for columns that can be totalled). This option is not available if no row groupings have been added to the report. •Export Values Only Report to Excel - When row grouping is enabled, users will be able to export the summarised value only data to Excel. This report will only contain the columns row grouping is enabled for, plus any value columns that can be totalled. This option is not available if no row groupings have been added to the report.
The exported reports will be formatted as a BBS Xcellerated Report containing a formatted worksheet with row grouping headers and sub-totals (if applicable), and also a flat file worksheet for further data manipulation. |
|
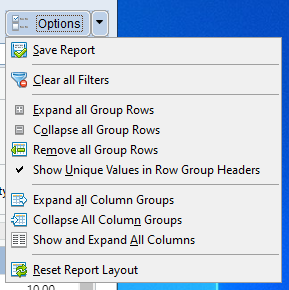
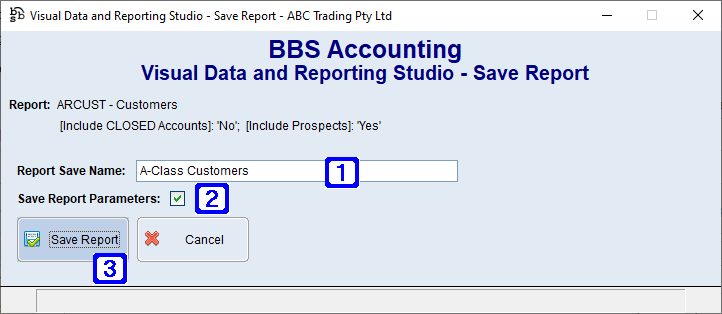
•Save Report - Allows users to save the current report parameters, layout, filters and grouping as a Saved User Report for future use. Refer to Saving Reports for more information.
•Clear all Filters - Clears all filters applied to the report.
•Expand all Group Rows - Expands all group rows. •Collapse all Group Rows - Collapses all group rows. •Remove all Group Rows - Removes all group rows from the report. •Show Unique Values in Row Group Headers - Toggles on or off whether row group headers should display values for columns that cannot be totalled where all data records in the group section contain a single unique value.
•Expand all Column Groups - Expands all column groups. •Collapse all Column Groups - Collapses all colour groups. •Show and Expand all Columns - Shows all available columns and expands all column groups.
•Reset Report Layout - Allows users to reset the report layout to the default.
|
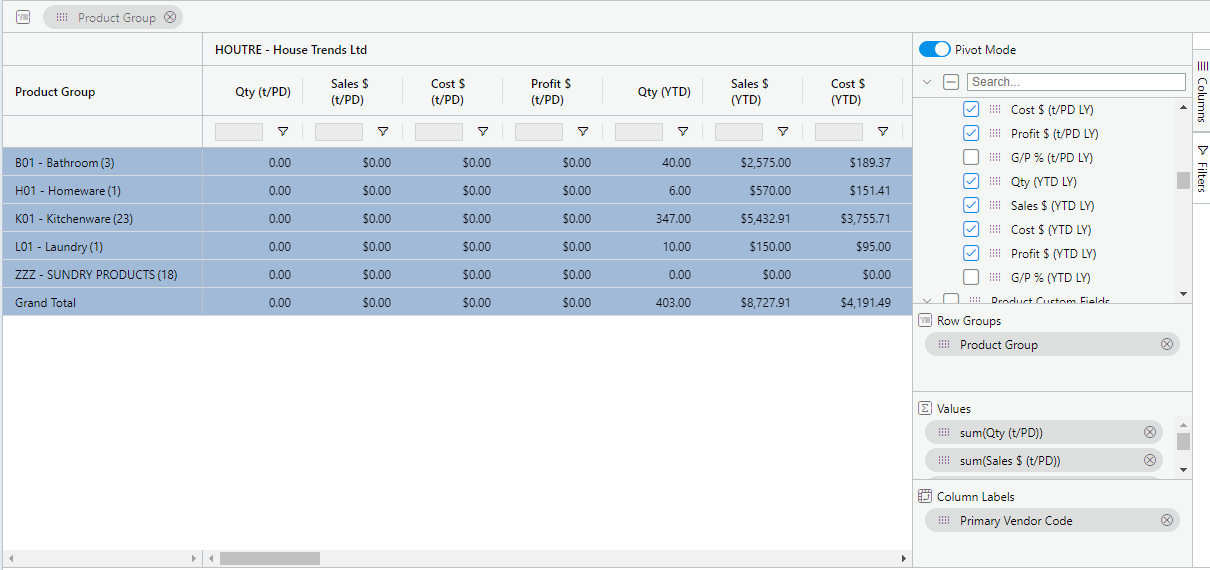
Pivot mode allows users to turn the created report into a Pivot Table. Pivot Mode can be toggled on or off via the Pivot Mode slider option in the Columns Sidebar.
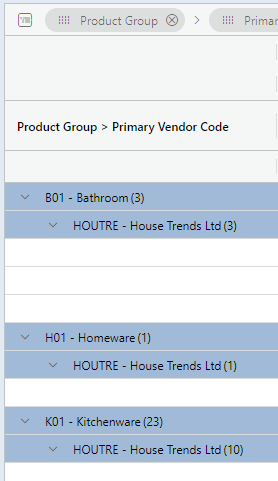
Row Grouping can be used to place columns as row dimensions on the pivot table (Product Group in the above example).
A Column Labels panel appears in the Columns Sidebar when Pivot Mode is enabled which allows users to drag columns into it to create a cross-tab pivot table which will show the values in groups across the top as well as by Row Grouping (Primary Vendor Code in the above example).
Values will then aggregate/total in the pivot table based on the selected Row Grouping and Column Labels. |










 icon for the column on the Row Group Panel

 or
or  arrows.
  ,
,  or
or  boxes.
 icon can be used to click and drag a column onto the report, drag the column to the Row Groups panel or can be right clicked to select Group By [Column Name] to enable row grouping for the column.
 icon.
icon. 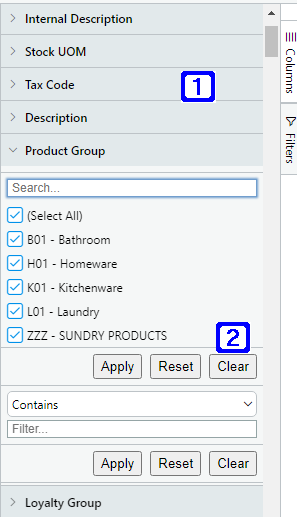
 or
or  icons allows users to expand or contract column filters.