|
Reports Menu > Sales Analysis > Sales Report Generator > Sales Report Generator - Period by Period |

|
Reports Menu > Sales Analysis > Sales Report Generator > Sales Report Generator - From/To Date |
|
Reports Menu > Sales Analysis > Sales Report Generator > Sales Report Generator - PTD/YTD |
Three Xcellerated reports exist to enable users to create just about any sales report they could need. All three reports operate in a similar way with the difference being the period the report can be run for and the columns of data that are displayed.
Sales Report Generator - Period by Period (SAPRG1) will display a selected number of months of either quantity, sales, cost, profit or G/P % from the accounting period selected (eg. selecting May 2019 and 24 months will show columns for May 2019 to April 2021)
Sales Report Generator – From/To Date (SAPRG2) will display total quantity, sales, cost, profit and G/P % for a date range selected (eg. from 07/04/2014 to 20/04/2014).
Sales Report Generator – PTD/YTD (SAPRG3) will display quantity, sales, cost, profit and G/P% for the selected accounting period, and for the accounting year to date for the selected accounting period (eg. PTD for March and YTD from July to March). Users can also select to display the PTD and YTD figures for the same period in the previous accounting year as well.
With all reports, users can select to restrict the report by warehouse, customers, invoice rep codes, customer default rep codes, market codes, customer classifications, customer referral sources, product codes, product groups, and product primary vendors. Users can then select whether to include invoices that have been excluded from sales analysis, and whether or not freight charged should be included.
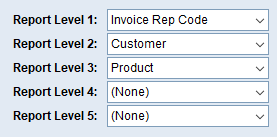
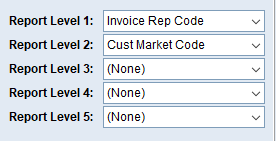
Users can then select up to five reporting levels to sort and sub-total the report by each level. The lowest level selected (the level with the highest number) is the item that the reporting figures are displayed against, while each of the higher levels will be used to sort and sub-total the report.
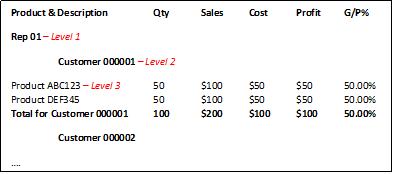
Example 1: Show product sales, by Invoice Rep Code then by individual Customer
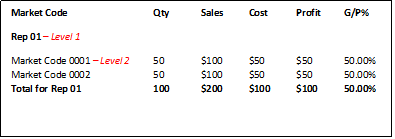
Example 2: Show sales by Market Code for each Invoice Rep Code
Please be aware that due to the flexibility of these reports, selecting certain options will result in meaningless reports such as total quantity by customer (meaningless due to units of measure), and market codes by customer (meaningless as a customer can only have one market code).
A good way to learn how to use these reports is through trial and error. When selecting reporting levels, it is best to think about how you want the report displayed (eg. Rep Code, THEN Customer THEN Product) and then select the levels in the same order.